A simple (predictive) analysis on IPL teams
2014-10I recently stumbled across a dataset providing data ball-by-ball of IPL matches (2008-2014). The data is provided as YAML files (one for each match) containing ball-by-ball details for each match. I transferred the data in these files into a relational database (MySQL) and made a small analysis on the performance of each team with a focus on identifying the factors influencing the performance of the teams.
I used Pandas, scikit-learn and matplotlib for this analysis.
Building a random forest classifier to predict outcome of IPL matches.
Tools used : Python (Pandas), MySQL.
Data source : http://cricsheet.org/
Set up connections to the SQL DB.
In [40]:
import pandas
import mysql.connector
# set up connections to the DB
conn = mysql.connector.Connect(host='localhost',user='root',\
                        password='',database='cricdata')
Retreive necessary data from the DB.
In [41]:
# Retreive Data teams, Outcome data from the DB
qryTeamWin = """
                SELECT Game.Id, Game.MatchDate, Game.Venue, Game.Overs,
                    Teams.Team1, Teams.Team2,
                    Outcome.Winner, Outcome.Runs, Outcome.Wickets, Outcome.Result,
                    Outcome.Eliminator, Outcome.Method
                FROM Game INNER JOIN Outcome
                    ON Game.Id = OutCome.MatchId
                INNER JOIN Teams
                    ON Game.Id = Teams.MatchId
             """
winTeamDF = pandas.read_sql( qryTeamWin, conn )
# print a sample of the data
print winTeamDF.head(5)
Id MatchDate Venue \
0 335982 2008-04-18 00:00:00 M Chinnaswamy Stadium
1 335983 2008-04-19 00:00:00 Punjab Cricket Association Stadium, Mohali
2 335984 2008-04-19 00:00:00 Feroz Shah Kotla
3 335985 2008-04-20 00:00:00 Wankhede Stadium
4 335986 2008-04-20 00:00:00 Eden Gardens
Overs Team1 Team2 \
0 20 Royal Challengers Bangalore Kolkata Knight Riders
1 20 Kings XI Punjab Chennai Super Kings
2 20 Delhi Daredevils Rajasthan Royals
3 20 Mumbai Indians Royal Challengers Bangalore
4 20 Kolkata Knight Riders Deccan Chargers
Winner Runs Wickets Result Eliminator Method
0 Kolkata Knight Riders 140 NaN None None None
1 Chennai Super Kings 33 NaN None None None
2 Delhi Daredevils NaN 9 None None None
3 Royal Challengers Bangalore NaN 5 None None None
4 Kolkata Knight Riders NaN 5 None None None
Get some basic stats - win/loss percentage by team.
In [42]:
import numpy
# We'll begin with the win/loss percent of teams.
# get the matches won/lost by each team.
# By grouping the DF according to the winning team.
bywinner = winTeamDF.groupby('Winner')
numWins = bywinner.size()
# Now we'll need the total number of matches
# played by each team.
teamList = bywinner.groups.keys()
# Loop through each team and identify the number of times
# the team appears either in the Team1 or Team2 col.
# we'll store this data in a seperate DF
teamMatchDF = pandas.DataFrame( columns=('team', 'short_name','matches', 'wins'),\
                               index=range(len(teamList)) )
for n, t in enumerate(teamList):
    nGames = winTeamDF[ (winTeamDF['Team1'] == t) |\
              (winTeamDF['Team2'] == t) ]\
            ['Id'].shape[0]
    # get the short name for plotting purposes
    shortName = ''.join( [ x[0] for x in t.split() ] )
    teamMatchDF.ix[n] = [ t, shortName, nGames, numWins[t] ]
# We now have the DF with team, num of matches and wins
# we'll now add an additional column win_percent
teamMatchDF['win_percent'] = (teamMatchDF['wins']*100./teamMatchDF['matches'])\
                                .apply(lambda x: round(x, 2))
print "--------------- Total team wins ------------------"
print teamMatchDF.sort( 'win_percent', ascending=False ).reset_index(drop=True)
print "--------------- Total team wins ------------------"
# Lets get the wins of each team by year
# we'll get the year from the MatchDate col
winTeamDF['year'] = pandas.DatetimeIndex( winTeamDF['MatchDate'] ).year
byYearWinner = winTeamDF.groupby( ['Winner','year'] )
numWinsYear = byYearWinner.size()
# we'll use a different DF to store wins by year.
teamYearList = byYearWinner.groups.keys()
teamWinYearDF = pandas.DataFrame( columns=('team', 'short_name', 'year', 'matches', 'wins'),\
                               index=range(len(teamYearList)) )
# Loop through the data populate the DB
for ny, ty in enumerate(teamYearList):
    # skip some None's
    if ty[0] is None:
        continue
    nGames = winTeamDF[ ( (winTeamDF['Team1'] == ty[0]) |\
              (winTeamDF['Team2'] == ty[0]) ) & ( winTeamDF['year'] == ty[1] )]\
            ['Id'].shape[0]
    shortName = ''.join( [ x[0] for x in ty[0].split() ] )
    teamWinYearDF.ix[ny] = [ ty[0], shortName, ty[1], nGames, numWinsYear[ty] ]
# get the win percent
print
print "--------------- Team wins by year ------------------"
teamWinYearDF['win_percent'] = (teamWinYearDF['wins']*100./teamWinYearDF['matches'])\
                                .apply(lambda x: round(x, 2))
# Drop NaN Vals
teamWinYearDF = teamWinYearDF[ numpy.isfinite( teamWinYearDF['win_percent'] ) ]
print teamWinYearDF.sort( 'win_percent', ascending=False ).reset_index(drop=True).head(10)
print "--------------- Team wins by year ------------------"
--------------- Total team wins ------------------
team short_name matches wins win_percent
0 Chennai Super Kings CSK 114 69 60.53
1 Mumbai Indians MI 110 63 57.27
2 Rajasthan Royals RR 104 54 51.92
3 Kings XI Punjab KXP 106 55 51.89
4 Kolkata Knight Riders KKR 104 53 50.96
5 Royal Challengers Bangalore RCB 107 52 48.60
6 Sunrisers Hyderabad SH 31 15 48.39
7 Kochi Tuskers Kerala KTK 14 6 42.86
8 Delhi Daredevils DD 105 44 41.90
9 Deccan Chargers DC 75 29 38.67
10 Pune Warriors PW 46 12 26.09
--------------- Total team wins ------------------
--------------- Team wins by year ------------------
team short_name year matches wins win_percent
0 Rajasthan Royals RR 2008 16 13 81.25
1 Kings XI Punjab KXP 2014 17 12 70.59
2 Kolkata Knight Riders KKR 2012 17 12 70.59
3 Kolkata Knight Riders KKR 2014 16 11 68.75
4 Chennai Super Kings CSK 2011 16 11 68.75
5 Mumbai Indians MI 2010 16 11 68.75
6 Mumbai Indians MI 2013 19 13 68.42
7 Kings XI Punjab KXP 2008 15 10 66.67
8 Chennai Super Kings CSK 2013 18 12 66.67
9 Delhi Daredevils DD 2009 15 10 66.67
--------------- Team wins by year ------------------
Plot of win% of teams over all years.
In [43]:
import matplotlib.pyplot as plt
import datetime
fig = plt.figure(figsize=(8,6))
ax1 = fig.add_subplot(111)
# plot total team wins
ax1 = teamMatchDF.plot(x='short_name', y='win_percent', kind='bar',\
                 ylim=[0,100], fontsize = 14, color='#1E90FF' )
ax1.set_ylabel( 'Win Percent', fontsize=16 )
yticks = [20, 40, 60, 80, 100]
ax1.yaxis.set_ticks(yticks)
ax1.set_yticklabels(yticks, fontsize=14)
ax1.set_xlabel( 'Team', fontsize=14 )
ax1.set_title( 'Win percent by teams', fontsize=16 )
ax1.patch.set_facecolor('gray')
ax1.patch.set_alpha(0.75)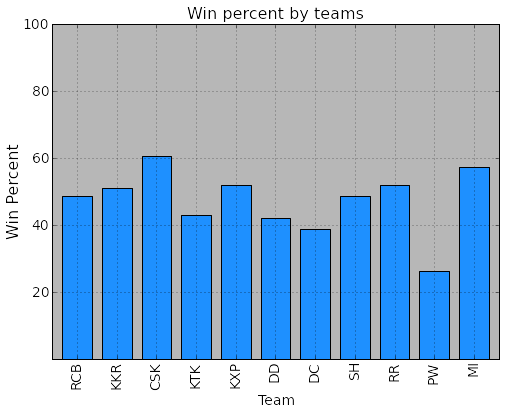
Win% of teams by year - consistency.
In [44]:
import numpy
fig = plt.figure(figsize=(8,6))
ax2 = fig.add_subplot(111)
# Set different colors
colormap = plt.cm.jet
plt.gca().set_color_cycle([colormap(i) for i in np.linspace(0, 0.9, len(teamList))])
labList = []
meanList = []
stdList = []
xDataList = [] # Holder for xaxis
for n, t in enumerate(teamList):
    currYears = list( teamWinYearDF[ teamWinYearDF['team'] == t ]['year'] )
    shortName = list( teamWinYearDF[ teamWinYearDF['team'] == t ]['short_name'] )[0]
    currDate = [ datetime.datetime.strptime(str(c), '%Y') for  c in currYears ]
    # Need to sort both date and win_percent according to date
    # We'll do it by zipping the values
    currWinPercnt = list( teamWinYearDF[ teamWinYearDF['team'] == t ]['win_percent'] )
    wdSort = zip( currDate, currWinPercnt )
    wdSort.sort()
    currDate = [y for y, x in wdSort]
    currWinPercnt = [x for y, x in wdSort]
    stats = numpy.array( currWinPercnt )
    labList.append( shortName )
    meanList.append( numpy.mean(stats) )
    stdList.append( numpy.std(stats) )
    xDataList.append( n )
# Plot the means, Std.Dev
ax2.errorbar(xDataList, meanList, yerr=stdList,\
             linestyle='None', marker='x', linewidth=3, \
             markersize=12, mew=2, color='#1E90FF')
#     ax2.plot( currDate, currWinPercnt, linewidth=2, label=t )
ax2.set_ylabel( 'Win Percent', fontsize=14 )
ax2.set_xlabel( 'Team', fontsize=14 )
ax2.set_title( 'Avg wins/year', fontsize=16 )
ax2.set_ylim( [0,100] )
ax2.set_xlim( [-1,11] )
ax2.xaxis.set_ticks(arange(11))
ax2.set_xticklabels(labList, fontsize=14)
ax2.tick_params(axis='y', labelsize=14)
ax2.grid()
ax2.patch.set_facecolor('gray')
ax2.patch.set_alpha(0.75)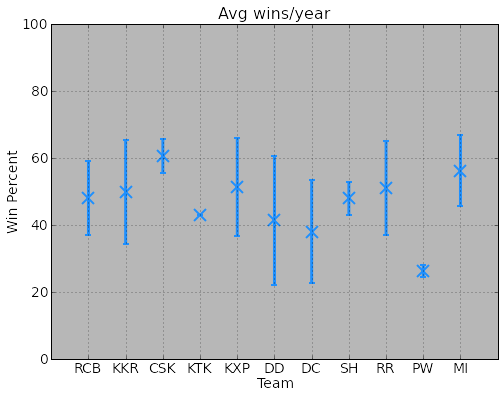
Performance by Venues - Home Advantage.
In [45]:
byVenueWinner = winTeamDF.groupby( ['Winner','Venue'] )
numWinsVenue = byVenueWinner.size()
# we'll use a different DF to store wins by year.
teamVenueList = byVenueWinner.groups.keys()
teamWinVenueDF = pandas.DataFrame( columns=('team', 'short_name', 'venue', 'matches', 'wins'),\
                               index=range(len(teamVenueList)) )
# we'll have a DF to just store home results (automatically identified by num matches)
homeAdvDF = pandas.DataFrame( columns=('team', 'home_venue', 'home_matches', 'home_wins'),\
                               index=range(len(teamVenueList)) )
# Loop through the data populate the DB
for ny, ty in enumerate(teamVenueList):
    # skip some None's
    if ty[0] is None:
        continue
    nGames = winTeamDF[ ( (winTeamDF['Team1'] == ty[0]) |\
              (winTeamDF['Team2'] == ty[0]) ) & ( winTeamDF['Venue'] == ty[1] )]\
            ['Id'].shape[0]
    shortName = ''.join( [ x[0] for x in ty[0].split() ] )
    teamWinVenueDF.ix[ny] = [ ty[0], shortName, ty[1], nGames, numWinsVenue[ty] ]
    # Get the home adv factor
    if nGames > 10:
        homeAdvDF.ix[ny] = [ ty[0], ty[1], nGames, numWinsVenue[ty] ]
# get the win percent
teamWinVenueDF['win_percent'] = (teamWinVenueDF['wins']*100./teamWinVenueDF['matches'])\
                                .apply(lambda x: round(x, 2))
homeAdvDF['home_win_percent'] = (homeAdvDF['home_wins']*100./homeAdvDF['home_matches'])\
                                .apply(lambda x: round(x, 2))
# Drop NaN Vals
teamWinVenueDF = teamWinVenueDF[ numpy.isfinite( teamWinVenueDF['win_percent'] ) ]
homeAdvDF = homeAdvDF[ numpy.isfinite( homeAdvDF['home_win_percent'] ) ]
# Now let's get the away wins as well by merging this DF
# with the DF containing all wins (teamMatchDF)
homeAwayDF = pandas.DataFrame( pandas.merge(teamMatchDF, homeAdvDF, on='team', how='inner') )
# Get Away matches and wins and %wins
homeAwayDF['away_matches'] = homeAwayDF['matches'] - homeAwayDF['home_matches']
homeAwayDF['away_wins'] = homeAwayDF['wins'] - homeAwayDF['home_wins']
homeAwayDF['away_win_percent'] = (homeAwayDF['away_wins']*100./homeAwayDF['away_matches'])\
                                .apply(lambda x: round(x, 2))
print "--------------- Home/Away team wins ------------------"
print homeAwayDF.sort( 'win_percent', ascending=False ).reset_index(drop=True).head(10)
print "--------------- Home/Away team wins ------------------"
--------------- Home/Away team wins ------------------
team short_name matches wins win_percent \
0 Chennai Super Kings CSK 114 69 60.53
1 Mumbai Indians MI 110 63 57.27
2 Rajasthan Royals RR 104 54 51.92
3 Kings XI Punjab KXP 106 55 51.89
4 Kolkata Knight Riders KKR 104 53 50.96
5 Royal Challengers Bangalore RCB 107 52 48.60
6 Sunrisers Hyderabad SH 31 15 48.39
7 Delhi Daredevils DD 105 44 41.90
8 Deccan Chargers DC 75 29 38.67
9 Pune Warriors PW 46 12 26.09
home_venue home_matches home_wins \
0 MA Chidambaram Stadium, Chepauk 40 27
1 Wankhede Stadium 33 22
2 Sawai Mansingh Stadium 33 24
3 Punjab Cricket Association Stadium, Mohali 31 17
4 Eden Gardens 38 24
5 M Chinnaswamy Stadium 40 21
6 Rajiv Gandhi International Stadium, Uppal 12 7
7 Feroz Shah Kotla 39 14
8 Rajiv Gandhi International Stadium, Uppal 18 3
9 Subrata Roy Sahara Stadium 16 4
home_win_percent away_matches away_wins away_win_percent
0 67.50 74 42 56.76
1 66.67 77 41 53.25
2 72.73 71 30 42.25
3 54.84 75 38 50.67
4 63.16 66 29 43.94
5 52.50 67 31 46.27
6 58.33 19 8 42.11
7 35.90 66 30 45.45
8 16.67 57 26 45.61
9 25.00 30 8 26.67
--------------- Home/Away team wins ------------------
Home/Away win% plots.
In [46]:
plotDF2 = homeAwayDF[ ['short_name', 'win_percent','home_win_percent', 'away_win_percent' ] ]
fig = plt.figure(figsize=(8,6))
ax = fig.add_subplot(111)
# plot total team wins
plotDF2[['win_percent','home_win_percent', 'away_win_percent']].\
                                                    plot( kind='bar', use_index=True,\
                                                       ax=ax, alpha=0.75,\
                                                       grid=True, color=['#1E90FF','#DC143C','green'])
ax.set_xlabel( 'Team', fontsize=14 )
ax.set_ylabel( 'Win Percent', fontsize=14 )
ax.set_title( 'Home/Away Win percent by teams', fontsize=16 )
ax.set_ylim( [0,100] )
ax.set_xticklabels(homeAwayDF['short_name'].values, fontsize=14)
ax.tick_params(axis='y', labelsize=14)
ax.grid()
ax.patch.set_facecolor('gray')
ax.patch.set_alpha(0.75)
ax.yaxis.grid() #vertical lines
ax.xaxis.grid() #horizontal lines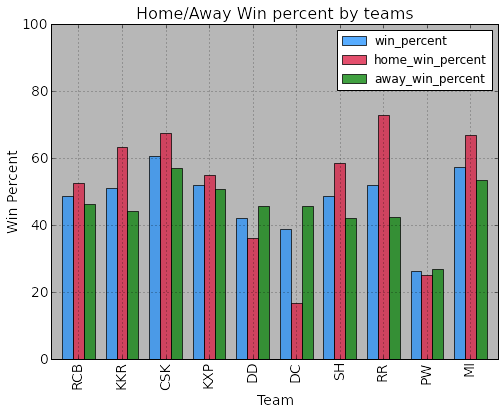
Influence of toss.
In [47]:
# Need a new query, retreive the toss data as well.
qryTeamToss = """
                SELECT Game.Id, Game.MatchDate, Game.Venue, Game.Overs,
                    Teams.Team1, Teams.Team2,
                    Outcome.Winner, Outcome.Runs, Outcome.Wickets, Outcome.Result,
                    Toss.Decision as tossDec, Toss.Winner as tossWin
                FROM Game INNER JOIN Outcome
                    ON Game.Id = OutCome.MatchId
                INNER JOIN Teams
                    ON Game.Id = Teams.MatchId
                INNER JOIN Toss
                    ON Game.Id = Toss.MatchId
             """
tossTeamDF = pandas.read_sql( qryTeamToss, conn )
# print a sample of the data
print tossTeamDF.head(5)
Id MatchDate Venue \
0 335982 2008-04-18 00:00:00 M Chinnaswamy Stadium
1 335983 2008-04-19 00:00:00 Punjab Cricket Association Stadium, Mohali
2 335984 2008-04-19 00:00:00 Feroz Shah Kotla
3 335985 2008-04-20 00:00:00 Wankhede Stadium
4 335986 2008-04-20 00:00:00 Eden Gardens
Overs Team1 Team2 \
0 20 Royal Challengers Bangalore Kolkata Knight Riders
1 20 Kings XI Punjab Chennai Super Kings
2 20 Delhi Daredevils Rajasthan Royals
3 20 Mumbai Indians Royal Challengers Bangalore
4 20 Kolkata Knight Riders Deccan Chargers
Winner Runs Wickets Result tossDec \
0 Kolkata Knight Riders 140 NaN None field
1 Chennai Super Kings 33 NaN None bat
2 Delhi Daredevils NaN 9 None bat
3 Royal Challengers Bangalore NaN 5 None bat
4 Kolkata Knight Riders NaN 5 None bat
tossWin
0 Royal Challengers Bangalore
1 Chennai Super Kings
2 Rajasthan Royals
3 Mumbai Indians
4 Deccan Chargers
In [48]:
import numpy
# We'll look at win/loss percent of teams as a function of toss.
# get the matches won/lost by each team.
# By grouping the DF according to the winning team.
bywin = tossTeamDF.groupby('Winner')
numWins = bywin.size()
# Now we'll need the total number of matches
# played by each team.
teamList = bywin.groups.keys()
# Loop through each team and identify the number of times
# the team appears either in the Team1 or Team2 col.
# we'll store this data in a seperate DF
teamTossWinDF = pandas.DataFrame( columns=('team', 'short_name','matches', 'wins', 'toss', 'toss_wins'),\
                               index=range(len(teamList)) )
for n, t in enumerate(teamList):
    nGames = tossTeamDF[ (tossTeamDF['Team1'] == t) |\
              (tossTeamDF['Team2'] == t) ]\
            ['Id'].shape[0]
    # num of times the team won toss
    nToss = tossTeamDF[ ( (tossTeamDF['Team1'] == t) |\
              (tossTeamDF['Team2'] == t) ) & ( tossTeamDF['tossWin'] == t ) ]\
            ['Id'].shape[0]
    # num of times the team won the match after winning toss
    nTossWins = tossTeamDF[ ( (tossTeamDF['Team1'] == t) |\
              (tossTeamDF['Team2'] == t) ) & ( tossTeamDF['tossWin'] == t ) \
                       & ( tossTeamDF['Winner'] == t ) ]\
            ['Id'].shape[0]
    shortName = ''.join( [ x[0] for x in t.split() ] )
    teamTossWinDF.ix[n] = [ t, shortName, nGames, numWins[t], nToss, nTossWins ]
# Calculate the general win %
teamTossWinDF['win_percent'] = (teamTossWinDF['wins']*100./teamTossWinDF['matches'])\
                                .apply(lambda x: round(x, 2))
# Calculate the win % after winning/loosing toss
teamTossWinDF['win_percent/win_toss'] = (teamTossWinDF['toss_wins']*100./teamTossWinDF['toss'])\
                                .apply(lambda x: round(x, 2))
teamTossWinDF['win_percent/loose_toss'] = ( ( teamTossWinDF['wins']-teamTossWinDF['toss_wins'] )\
                                         *100./(teamTossWinDF['matches']-teamTossWinDF['toss']) )\
                                .apply(lambda x: round(x, 2))
print teamTossWinDF
team short_name matches wins toss toss_wins \
0 Royal Challengers Bangalore RCB 107 52 45 22
1 Kolkata Knight Riders KKR 104 53 55 29
2 Chennai Super Kings CSK 114 69 56 37
3 Kochi Tuskers Kerala KTK 14 6 8 4
4 Kings XI Punjab KXP 106 55 51 25
5 Delhi Daredevils DD 105 44 51 21
6 Deccan Chargers DC 75 29 43 19
7 Sunrisers Hyderabad SH 31 15 14 4
8 Rajasthan Royals RR 104 54 57 30
9 Pune Warriors PW 46 12 20 3
10 Mumbai Indians MI 110 63 58 33
win_percent win_percent/win_toss win_percent/loose_toss
0 48.60 48.89 48.39
1 50.96 52.73 48.98
2 60.53 66.07 55.17
3 42.86 50.00 33.33
4 51.89 49.02 54.55
5 41.90 41.18 42.59
6 38.67 44.19 31.25
7 48.39 28.57 64.71
8 51.92 52.63 51.06
9 26.09 15.00 34.62
10 57.27 56.90 57.69
In [49]:
plotDF3 = teamTossWinDF[ ['short_name', 'win_percent/win_toss','win_percent/loose_toss' ] ]
fig = plt.figure(figsize=(8,6))
ax = fig.add_subplot(111)
# plot total team wins
plotDF3[['win_percent/win_toss','win_percent/loose_toss']].\
                                                    plot( kind='bar', use_index=True,\
                                                       ax=ax, alpha=0.75,\
                                                       grid=True, color=['#1E90FF','#DC143C'])
ax.set_xlabel( 'Team', fontsize=14 )
ax.set_ylabel( 'Win Percent', fontsize=14 )
ax.set_title( 'Win percent with toss', fontsize=16 )
ax.set_ylim( [0,100] )
ax.set_xticklabels(teamTossWinDF['short_name'].values, fontsize=14)
ax.tick_params(axis='y', labelsize=14)
ax.grid()
ax.patch.set_facecolor('gray')
ax.patch.set_alpha(0.75)
ax.yaxis.grid() #vertical lines
ax.xaxis.grid() #horizontal lines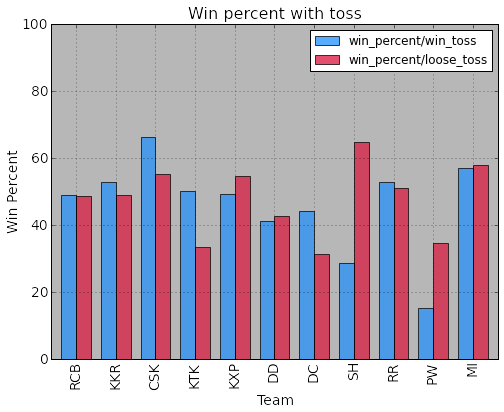
Influence of batting/fielding first.
In [50]:
import numpy
# We'll look at win/loss percent of teams as a function of toss.
# get the matches won/lost by each team.
# By grouping the DF according to the winning team.
bywin = tossTeamDF.groupby('Winner')
numWins = bywin.size()
# Now we'll need the total number of matches
# played by each team.
teamList = bywin.groups.keys()
# Loop through each team and identify the number of times
# the team appears either in the Team1 or Team2 col.
# we'll store this data in a seperate DF
teamBatWinDF = pandas.DataFrame( columns=('team', 'short_name','matches',\
                                          'wins', 'bat_first', 'wins/bat_first',\
                                          'field_first', 'wins/field_first'),\
                               index=range(len(teamList)) )
for n, t in enumerate(teamList):
    nGames = tossTeamDF[ (tossTeamDF['Team1'] == t) |\
              (tossTeamDF['Team2'] == t) ]\
            ['Id'].shape[0]
    # num of times the team batted first and won, this has two parts,
    # 1) win toss - bat, 2) loose toss - field
    nBatFirstWin1 = tossTeamDF[ ( (tossTeamDF['Team1'] == t) |\
              (tossTeamDF['Team2'] == t) ) & ( tossTeamDF['tossWin'] == t ) \
                       & ( tossTeamDF['tossDec'] == 'bat' ) & ( tossTeamDF['Winner'] == t ) ]\
            ['Id'].shape[0]
    nBatFirstWin2 = tossTeamDF[ ( (tossTeamDF['Team1'] == t) |\
              (tossTeamDF['Team2'] == t) ) & ( tossTeamDF['tossWin'] != t ) \
                       & ( tossTeamDF['tossDec'] == 'field' ) & ( tossTeamDF['Winner'] == t ) ]\
            ['Id'].shape[0]
    nBatFirstWin = nBatFirstWin1 + nBatFirstWin2
    # For % need the number of times the team batted first (irrespective of wins)
    nBatFirst1 = tossTeamDF[ ( (tossTeamDF['Team1'] == t) |\
              (tossTeamDF['Team2'] == t) ) & ( tossTeamDF['tossWin'] == t ) \
                       & ( tossTeamDF['tossDec'] == 'bat' ) ]\
            ['Id'].shape[0]
    nBatFirst2 = tossTeamDF[ ( (tossTeamDF['Team1'] == t) |\
              (tossTeamDF['Team2'] == t) ) & ( tossTeamDF['tossWin'] != t ) \
                       & ( tossTeamDF['tossDec'] == 'field' ) ]\
            ['Id'].shape[0]
    nBatFirst = nBatFirst1 + nBatFirst2
    # Same calculations for field first
    nFieldFirstWin1 = tossTeamDF[ ( (tossTeamDF['Team1'] == t) |\
              (tossTeamDF['Team2'] == t) ) & ( tossTeamDF['tossWin'] == t ) \
                       & ( tossTeamDF['tossDec'] == 'field' ) & ( tossTeamDF['Winner'] == t ) ]\
            ['Id'].shape[0]
    nFieldFirstWin2 = tossTeamDF[ ( (tossTeamDF['Team1'] == t) |\
              (tossTeamDF['Team2'] == t) ) & ( tossTeamDF['tossWin'] != t ) \
                       & ( tossTeamDF['tossDec'] == 'bat' ) & ( tossTeamDF['Winner'] == t ) ]\
            ['Id'].shape[0]
    nFieldFirstWin = nFieldFirstWin1 + nFieldFirstWin2
    # For % need the number of times the team batted first (irrespective of wins)
    nFieldFirst1 = tossTeamDF[ ( (tossTeamDF['Team1'] == t) |\
              (tossTeamDF['Team2'] == t) ) & ( tossTeamDF['tossWin'] == t ) \
                       & ( tossTeamDF['tossDec'] == 'field' ) ]\
            ['Id'].shape[0]
    nFieldFirst2 = tossTeamDF[ ( (tossTeamDF['Team1'] == t) |\
              (tossTeamDF['Team2'] == t) ) & ( tossTeamDF['tossWin'] != t ) \
                       & ( tossTeamDF['tossDec'] == 'bat' ) ]\
            ['Id'].shape[0]
    nFieldFirst = nFieldFirst1 + nFieldFirst2
    shortName = ''.join( [ x[0] for x in t.split() ] )
    teamBatWinDF.ix[n] = [ t, shortName, nGames, numWins[t]\
                          , nBatFirst, nBatFirstWin, \
                          nFieldFirst, nFieldFirstWin ]
# Calculate the win %
teamBatWinDF['win_percent/bat_first'] = (teamBatWinDF['wins/bat_first']*100./teamBatWinDF['bat_first'])\
                                .apply(lambda x: round(x, 2))
teamBatWinDF['win_percent/field_first'] = (teamBatWinDF['wins/field_first']*100./teamBatWinDF['field_first'])\
                                .apply(lambda x: round(x, 2))
print teamBatWinDF
team short_name matches wins bat_first \
0 Royal Challengers Bangalore RCB 107 52 46
1 Kolkata Knight Riders KKR 104 53 51
2 Chennai Super Kings CSK 114 69 66
3 Kochi Tuskers Kerala KTK 14 6 7
4 Kings XI Punjab KXP 106 55 54
5 Delhi Daredevils DD 105 44 44
6 Deccan Chargers DC 75 29 43
7 Sunrisers Hyderabad SH 31 15 19
8 Rajasthan Royals RR 104 54 49
9 Pune Warriors PW 46 12 20
10 Mumbai Indians MI 110 63 59
wins/bat_first field_first wins/field_first win_percent/bat_first \
0 19 61 33 41.30
1 23 53 30 45.10
2 38 48 31 57.58
3 2 7 4 28.57
4 23 52 32 42.59
5 14 61 30 31.82
6 18 32 11 41.86
7 7 12 8 36.84
8 20 55 34 40.82
9 6 26 6 30.00
10 34 51 29 57.63
win_percent/field_first
0 54.10
1 56.60
2 64.58
3 57.14
4 61.54
5 49.18
6 34.38
7 66.67
8 61.82
9 23.08
10 56.86
In [51]:
plotDF4 = teamBatWinDF[ ['short_name', 'win_percent/bat_first','win_percent/field_first' ] ]
fig = plt.figure(figsize=(8,6))
ax = fig.add_subplot(111)
# plot total team wins
plotDF4[['win_percent/bat_first','win_percent/field_first']].\
                                                    plot( kind='bar', use_index=True,\
                                                       ax=ax, alpha=0.75,\
                                                       grid=True, color=['#1E90FF','#DC143C'])
ax.set_xlabel( 'Team', fontsize=14 )
ax.set_ylabel( 'Win Percent', fontsize=14 )
ax.set_title( 'Win percent with toss', fontsize=16 )
ax.set_ylim( [0,100] )
ax.set_xticklabels(teamBatWinDF['short_name'].values, fontsize=14)
ax.tick_params(axis='y', labelsize=14)
ax.grid()
ax.patch.set_facecolor('gray')
ax.patch.set_alpha(0.75)
ax.yaxis.grid() #vertical lines
ax.xaxis.grid() #horizontal lines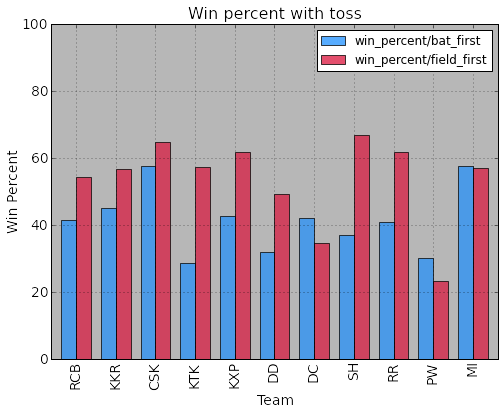
Build model(s) to predict outcomes.
In [52]:
qryMatData = """
SELECT Game.Id, Game.MatchDate, Game.Venue, Game.Overs,
Teams.Team1, Teams.Team2,
Outcome.Winner, Outcome.Runs, Outcome.Wickets, Outcome.Result,
Toss.Decision as tossDec, Toss.Winner as tossWin
FROM Game INNER JOIN Outcome
ON Game.Id = OutCome.MatchId
INNER JOIN Teams
ON Game.Id = Teams.MatchId
INNER JOIN Toss
ON Game.Id = Toss.MatchId
"""
matchDataDF = pandas.read_sql( qryMatData, conn )
print matchDataDF.head(2)
Id MatchDate Venue \
0 335982 2008-04-18 00:00:00 M Chinnaswamy Stadium
1 335983 2008-04-19 00:00:00 Punjab Cricket Association Stadium, Mohali
Overs Team1 Team2 \
0 20 Royal Challengers Bangalore Kolkata Knight Riders
1 20 Kings XI Punjab Chennai Super Kings
Winner Runs Wickets Result tossDec \
0 Kolkata Knight Riders 140 NaN None field
1 Chennai Super Kings 33 NaN None bat
tossWin
0 Royal Challengers Bangalore
1 Chennai Super Kings
Clean the data -> convert strings (teams, venues) to numbers.
In [53]:
def get_bat_first(inputDF):
    """
    Function to get whose batting first
    """
    if inputDF['tossDec'] == 0:
        if inputDF['Winner_Id'] == inputDF['Team1_Id']:
            return inputDF['Team1_Id']
        else:
            return inputDF['Team2_Id']
    else:
        if inputDF['Winner_Id'] == inputDF['Team1_Id']:
            return inputDF['Team2_Id']
        else:
            return inputDF['Team1_Id']

matchDataDF = pandas.read_sql( qryMatData, conn )
# The sklearn classifier doesn't deal well with strings
# so convert the strings to nums, basically we'll
# assign an id to the teams and venues and toss Decision
# Change toss dec
matchDataDF["tossDec"] = matchDataDF["tossDec"].\
apply(lambda tossDec: 0 if tossDec == "bat" else 1)
# Now we'll use the awesome functions of Pandas to deal with
# the teams and venues data. BTW there is a data type called
# categorical in Pandas. Look into it.
# Need to inner join both team1 and team2 data to make sure
# we dont miss any teams
allTeams = pandas.Series( \
                         pandas.concat( \
                        [ matchDataDF['Team1'], matchDataDF['Team2'] ] )\
                         .unique() )
# use the categorical functions of pandas to convert our
# string type teams into numeric values
venueIdx = pandas.Index( matchDataDF['Venue'].unique() )
cVenue = pandas.Categorical( \
                venueIdx.get_indexer(matchDataDF['Venue']), venueIdx )
matchDataDF['Venue_Id'] = cVenue.labels
# Teams is a bit complicated as we need the same
# team id for 4 different columns
teamIdx = pandas.Index( allTeams )
cTeam1 = pandas.Categorical( \
                teamIdx.get_indexer(matchDataDF['Team1']), teamIdx )
cTeam2 = pandas.Categorical( \
                teamIdx.get_indexer(matchDataDF['Team2']), teamIdx )
cWinner = pandas.Categorical( \
                teamIdx.get_indexer(matchDataDF['Winner']), teamIdx )
cTossWin = pandas.Categorical( \
                teamIdx.get_indexer(matchDataDF['tossWin']), teamIdx )
matchDataDF['Team1_Id'] = cTeam1.labels
matchDataDF['Team2_Id'] = cTeam2.labels
matchDataDF['Winner_Id'] = cWinner.labels
matchDataDF['tossWin_Id'] = cTossWin.labels
# We'll add a bat_first column to see if it improves predictions
matchDataDF['bat_first'] = matchDataDF.apply( get_bat_first, axis=1 )
# drop the columns we dont need
matchDataDF = matchDataDF.drop(\
                    ['Winner', 'Team1', 'Team2', 'Venue', 'tossWin'], axis=1 )
print matchDataDF.head(5)
Id MatchDate Overs Runs Wickets Result tossDec Venue_Id \
0 335982 2008-04-18 00:00:00 20 140 NaN None 1 0
1 335983 2008-04-19 00:00:00 20 33 NaN None 0 1
2 335984 2008-04-19 00:00:00 20 NaN 9 None 0 2
3 335985 2008-04-20 00:00:00 20 NaN 5 None 0 3
4 335986 2008-04-20 00:00:00 20 NaN 5 None 0 4
Team1_Id Team2_Id Winner_Id tossWin_Id bat_first
0 0 4 4 0 0
1 1 7 7 7 7
2 2 5 2 5 2
3 3 0 0 3 0
4 4 6 4 6 4
Random forest classifier.
In [54]:
# Import the random forest package
import numpy
from sklearn.ensemble import RandomForestClassifier
# Create the random forest object which will include all the parameters
# for the fit
forest = RandomForestClassifier(n_estimators = 1000)
# Now we need to remove the matches for which there were no winners
matchDataDF = matchDataDF[matchDataDF['Winner_Id'] != -1]
# Divide into test and training sets
matchDataDF['is_train'] = numpy.random.uniform( 0, 1, len(matchDataDF) ) <= .8
# Divide the data into training and test sets
train, test = matchDataDF[matchDataDF['is_train']==True],\
matchDataDF[matchDataDF['is_train']==False]
# The features which we'll take in as inputs
features = matchDataDF.columns[ [ 6, 7, 8, 9, 11, 12 ] ]
# Fit the data using random forests
rfFit = forest.fit( train[features], train['Winner_Id'] )
Test the classifier.
In [55]:
# Test the classifier
from sklearn.cross_validation import cross_val_score
rfTestOut = rfFit.predict(test[features])
test['Winner_Id_pred_RF'] = rfTestOut
crctPred = test[ test['Winner_Id'] == test['Winner_Id_pred_RF'] ].shape[0]
wrngPred = test[ test['Winner_Id'] != test['Winner_Id_pred_RF'] ].shape[0]
# Accurate pred. percent
percAccrcy = round( crctPred*100./(crctPred+wrngPred), 2 )
print "##### TESTING RANDOM FOREST CLASSIFIER ####"
print "Accuracy over all test set-->", percAccrcy, '%'
valdtDF = pandas.crosstab(test['Winner_Id'], rfTestOut, \
                      rownames=['actual'], colnames=['preds'])
# Now loop through and find accuracy over each team
print "------individual team predictions-------"
for cc in valdtDF.columns:
    currDet = valdtDF[cc]
    # Correct pred
    if cc in currDet:
        currPercCrct = \
        round( currDet[cc]*100./currDet.sum(), 2 )
    else:
        currPercCrct = 0
    print teamIdx[cc], '---->', currPercCrct, '%'
print "##### TESTING RANDOM FOREST CLASSIFIER ####"
##### TESTING RANDOM FOREST CLASSIFIER ####
Accuracy over all test set--> 69.23 %
------individual team predictions-------
Royal Challengers Bangalore ----> 66.67 %
Kings XI Punjab ----> 75.0 %
Delhi Daredevils ----> 46.15 %
Mumbai Indians ----> 88.89 %
Kolkata Knight Riders ----> 72.73 %
Rajasthan Royals ----> 58.33 %
Deccan Chargers ----> 66.67 %
Chennai Super Kings ----> 80.0 %
Sunrisers Hyderabad ----> 0.0 %
##### TESTING RANDOM FOREST CLASSIFIER ####
The most important features.
In [56]:
print " Random Forest Feature Importances "
for nfea, fea in enumerate(features):
    print fea, '--->', rfFit.feature_importances_[nfea]
print " Random Forest Feature Importances "
Random Forest Feature Importances
tossDec ---> 0.128036711172
Venue_Id ---> 0.148671698856
Team1_Id ---> 0.159167269973
Team2_Id ---> 0.176963645973
tossWin_Id ---> 0.165245937002
bat_first ---> 0.221914737024
Random Forest Feature Importances
Compare With Naive Bayes Classifier.
In [57]:
from sklearn.naive_bayes import GaussianNB
# Instantiate the estimator
nbClf = GaussianNB()
nbFit = nbClf.fit( train[features], train['Winner_Id'] )
nbTestOut = nbFit.predict( test[features] )
test['Winner_Id_pred_NB'] = nbTestOut
crctPredNB = test[ test['Winner_Id'] == test['Winner_Id_pred_NB'] ].shape[0]
wrngPredNB = test[ test['Winner_Id'] != test['Winner_Id_pred_NB'] ].shape[0]
# Accurate pred. percent
percAccrcyNB = round( crctPredNB*100./(crctPredNB+wrngPredNB), 2 )
print "Naive Bayes accuracy over all test set-->", percAccrcyNB, '%'
print "You can see, why NB is bad. The parameters are very interdependent."
Naive Bayes accuracy over all test set--> 23.08 %
You can see, why NB is bad. The parameters are very interdependent.
Compare with SVM.
In [58]:
from sklearn import svm
svmClf = svm.SVC()
svmFit = svmClf.fit( train[features], train['Winner_Id'] )
svmTestOut = svmFit.predict( test[features] )
test['Winner_Id_pred_SVM'] = svmTestOut
crctPredSVM = test[ test['Winner_Id'] == test['Winner_Id_pred_SVM'] ].shape[0]
wrngPredSVM = test[ test['Winner_Id'] != test['Winner_Id_pred_SVM'] ].shape[0]
# Accurate pred. percent
percAccrcySVM = round( crctPredSVM*100./(crctPredSVM+wrngPredSVM), 2 )
print "SVM accuracy over all test set-->", percAccrcySVM, '%'
SVM accuracy over all test set--> 49.45 %